Welcome to Little Learnings, a series of educational posts I release every Friday. The intention behind these is to break down some new interesting topic or development happening in the crypto space. God knows there’s enough happening in crypto, and it’s often complicated — so I’m here to try and simplify it a bit.
This post is sponsored by BALLGAME.COM
Most “crypto x sports” projects don’t interest me tbh. They’re either drowning in overly complex tokenomics or solving problems nobody had. BALLGAME.COM started with the behaviour, not the blockchain, and that’s why it works.
Sports fans already call the game. BALLGAME.COM just turns that instinct into real upside. Make YES/NO predictions on live sports, earn entries into daily lottery draws with $100 USDC up for grabs everyday. Free to play. No deposits, no gambling with your own funds.
The draws are fully on-chain, provably fair, and the infrastructure is invisible. You’re just calling the game.
Today we’re covering something that everyone in crypto looks at but most people don’t fully understand: token charts.
I gotta be honest and admit that I am not a technical analysis expert. Far, far from it, actually. I don’t draw on charts and predict price movements (I have mad respect for the very few people who can actually do this). I honestly think that most of the time, technical analysis in crypto is about as reliable as reading tea leaves (or as the joke goes: TA is astrology for men).
But understanding the basics of how to read a chart is still an incredibly useful skill. It helps you understand what’s happening with a token and make more informed decisions.
Many of you might find all of the below super obvious. If you’ve been around for a while, and especially if you’ve been actively trading onchain, you’ll probably know all of this. But maybe there’s a nugget in there you didn’t know. And if you’re newer to the space, or to trading, then I think this is invaluable information that everyone needs to know.
Price vs Market Cap
Before we even look at a chart, let me clear up the most common misconception. The price of a token means very little on its own.
A token at $0.001 is not cheap. A token at $500 is not expensive. What matters is the market cap: price multiplied by the number of tokens in circulation.
A $0.001 token with 100 billion tokens in circulation has a $100 million market cap. A $50 token with 1 million tokens in circulation has a $50 million market cap. The second one is half the size despite the “higher” price. The second one is actually the cheap one.
Always look at market cap. It tells you the actual size and valuation of the project.
Candlesticks
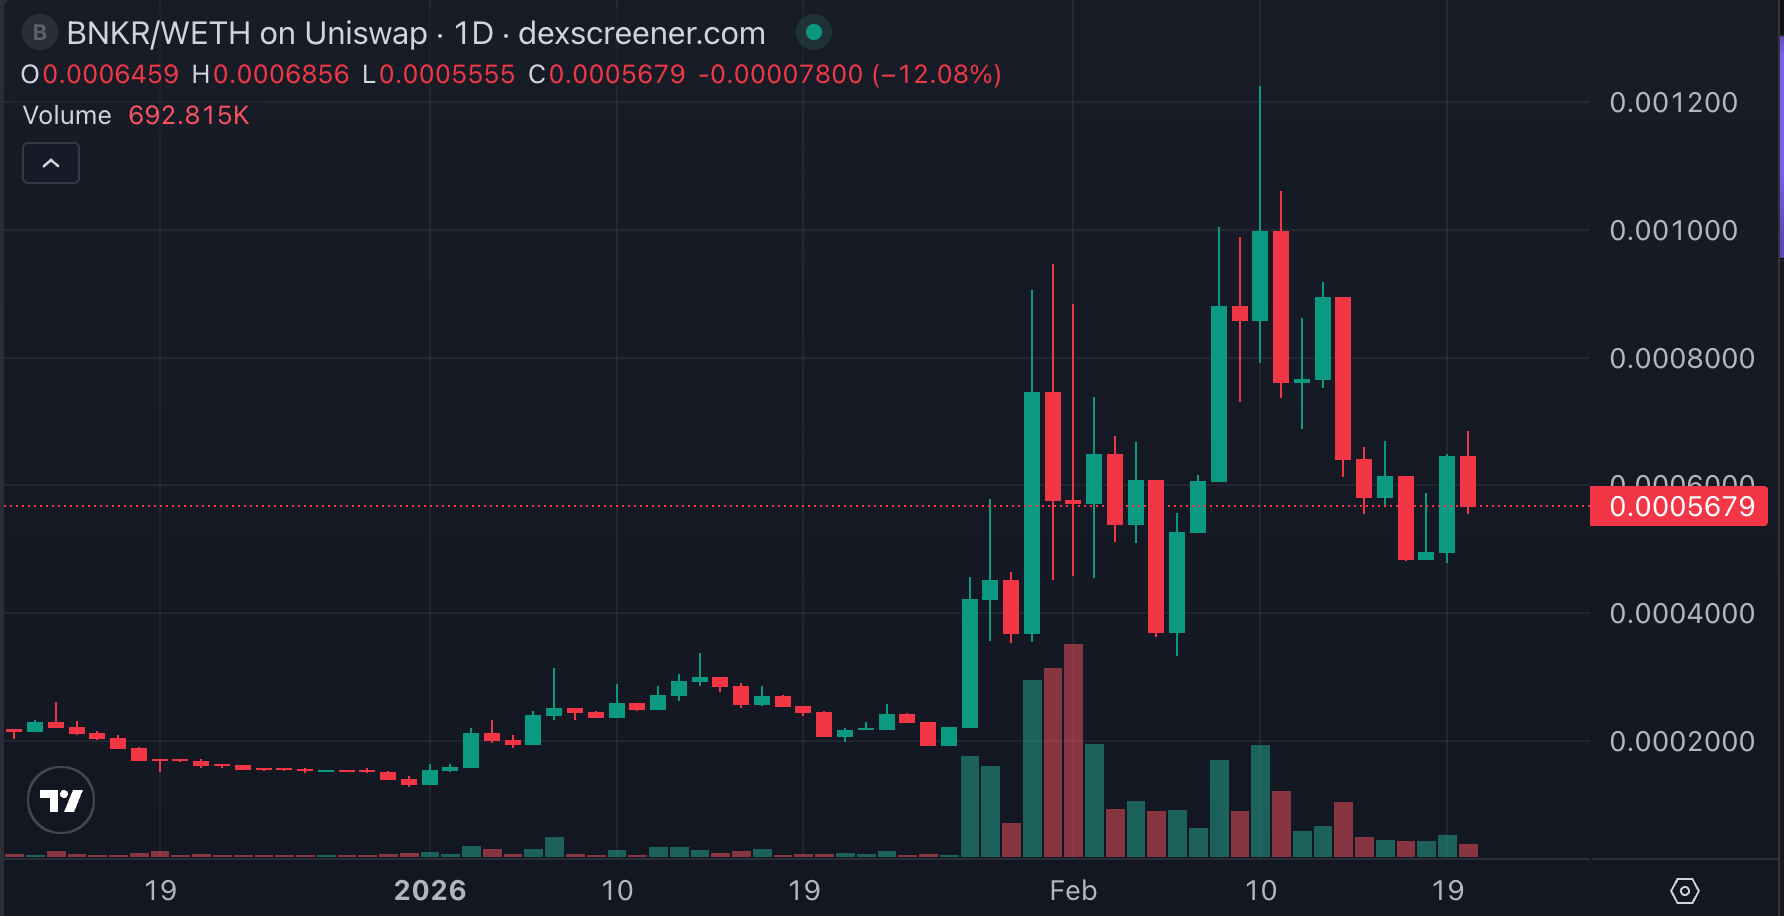
Let’s look at a real chart now.
Most crypto charts use candlesticks. Each candle represents a time period (1 hour, 1 day, 1 week, depending on your settings). This chart is on the 1D setting (see the top, after “Uniswap”), meaning each candlestick represents a day.
A green candle means the price went up during that period. The bottom of the body is where it opened, the top is where it closed.
A red candle means the price went down. The top of the body is the open, the bottom is the close.
The thin lines above and below the body are called wicks. They show the highest and lowest prices during that period, even though the price didn’t stay there.
A candle with a long wick on top and a small body at the bottom means there was a lot of selling pressure. Buyers pushed the price up, but sellers pushed it right back down. This often signals resistance.
A candle with a long wick on the bottom and a small body at the top means the opposite. Sellers pushed it down, buyers bought it back up. This can signal support.
Support and Resistance
Support is a price level where buying tends to increase. The token has bounced off this level before, so traders expect it to bounce again. Think of it as a floor.
Resistance is a price level where selling tends to increase. The token has struggled to break above this level before. Think of it as a ceiling.
These levels form because humans are predictable. People set buy orders at round numbers. People sell at prices where they previously bought (to break even). These patterns create zones where supply and demand cluster.
Support and resistance aren’t guarantees (far, far from it). They break all the time. But they’re somewhat useful for understanding where other traders are likely to act. I think sometimes they become self-fulfilling prophecies, but still, useful to know.
Volume
Volume tells you how many tokens were traded during a period. It appears as bars at the bottom of most charts.
High volume on a price increase means lots of people are buying with conviction. The move is more likely to sustain.
High volume on a price decrease means lots of people are selling. The drop is more significant.
Low volume on any move means fewer people are participating. The move is less trustworthy and more likely to reverse.
Volume confirms trends. A price increase on low volume is suspicious. A price increase on high volume is more convincing.
I’ve found that volume is one of the most important things to pay attention to. A token price that is going up but on very little volume is usually super risky to get involved with, for instance. Sometimes, especially on lowercap tokens, it literally means that there’s a bunch of people awake and paying attention who are buying, but when the rest of the holders who are asleep or not watching the chart come back and see the price action, they’re very liable to sell.
More volume = more confidence, generally speaking.
How helpful is technical analysis?
For most people, technical analysis is more distracting than helpful. I’ve always believed that the crypto market is driven largely by narratives, news events, whale movements, and sentiment. A chart pattern can be invalidated in seconds by a single tweet by a certain president, or by Vitalik, or an announcement by the head of whatever project the token represents.
Use charts as one tool among many. Don’t build your entire strategy around them. And definitely, as a default, don’t trust people who claim they can predict the market with lines on a chart. 99 times out of 100 they’re a charlatan.
I know there are a lot of people out there who aren’t super familiar with these concepts, so hopefully if you read until here, you learned something from this post :)
Thanks for reading, see you next week with another little learning!
Disclaimer: The content covered in this newsletter is not to be considered as investment advice. I’m not a financial adviser. These are only my own opinions and ideas. You should always consult with a professional/licensed financial adviser before trading or investing in any cryptocurrency related product. Some of the links shared may be referral links.
Great post as always. I think Technical Analysis does have its place, and can be a very helpful tool in a trader or investor’s toolbox. For degen casino players on high speculation and zero foxes it may be less so 😉
When you talk about how narratives and other factors have more importance. That’s not untrue, but I think TA can help in giving ideas for how far something could go, when there may be decision times, when you may want to set your Take Profits or Stop Losses etc.
I also think they’re usually more beneficial on longer timelines or assets and likely not very helpful or accurate in fresh tokens and short timelines frames. Which is a lot of what people in this space play at/with.
Anyhoo… time to cook dinner! Miss ya and hope we get to hangout again Wednesday!